Control Systems::Bode Plot
To draw a bode plot , follow these simple steps:
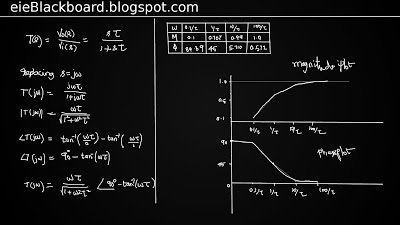
Magnitude Plot:
Put the frequency response equation into bode equation form. identify the DC gain value, and mark this as a horizontal line coming in from the far left (where the radial frequency conceptually is zero). At every “zero” break point, increase the slope of the line upwards by 20db/decade. At every “pole” break point, decrease the slope of the line downwards by 20db/decade. at every breakpoint, note that the “actual value” is 3db off from the value graphed.
Phase Plot
If A is positive, start your graph (with zero slope) at 0 degrees. If A is negative, start your graph with zero slope at 180 degrees (or -180 degrees, they are the same thing). For every zero, slope the line up at 45 degrees per decade when ω = \frac{z_n}{10} (1 decade before the break frequency). Multiple zeros means the slope is steeper. For every pole, slope the line down at 45 degrees per decade when ω = \frac{p_m}{10} (1 decade before the break frequency). Multiple poles means the slope is steeper. Flatten the slope again when the phase has changed by 90 degrees (for a zero) or -90 degrees (for a pole) (or larger values, for multiple poles or multiple zeros.